


What my liberal friends need to understand about taxes, and more
What's a fair share of taxes? Would the top 1% contributing 40% and bottom 50% contributing 3% of all federal income taxes be fair? (Oh, some myths held by conservatives, too.)

In case you missed it, the Philadelphia Eagles won the Super Bowl yesterday, rather convincingly. Now, back to our regularly scheduled program.
Extending the $4 trillion in expiring tax cuts is a huge priority for the Republicans. Those tax changes were generally considered as skewing most of the benefits toward the upper echelon of taxpayers.
The Republicans do have a case that the very rich—and by this I mean the top one percent of taxpayers— currently fund the lion’s share of the government.
Whether it’s from Bernie or my many friends who are more progressive than I, there is a sentiment that the country is not providing the social services that are needed. Their mantra is that could be remedied if only the “millionaires and billionaires” would pay their “fair share” of taxes. The clear implication is that if we taxed the rich more, we would have a windfall of cash to help those less well-off.
Numbers and graphs to follow
Now, I know for some readers here, eyes glaze over when numbers and graphs are involved, while others of you just eat it up. If you are among the former, I think it will be worthwhile to stay with me here. All the following numbers have been adjusted to account for inflation.
Part 1: What the liberals don’t get
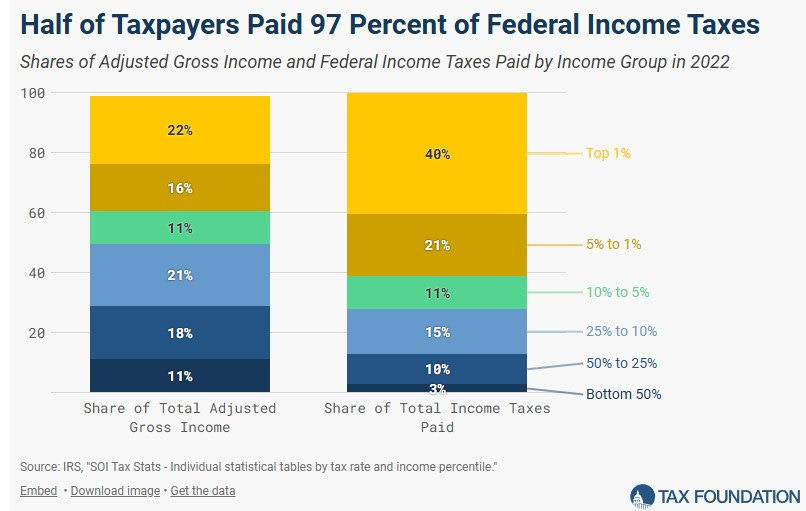
The reality is that raising taxes on the top one percent of taxpayers would not move the needle much, given the $4.9 trillion collected in taxes in 2024. As seen in the chart below, the top one percent account for 22% of total adjusted gross income but pay 40% of all income taxes collected by the government. On the other hand, the bottom 50% of taxpayers account for 11% of all income but are now paying only 3.3% of tax revenue.
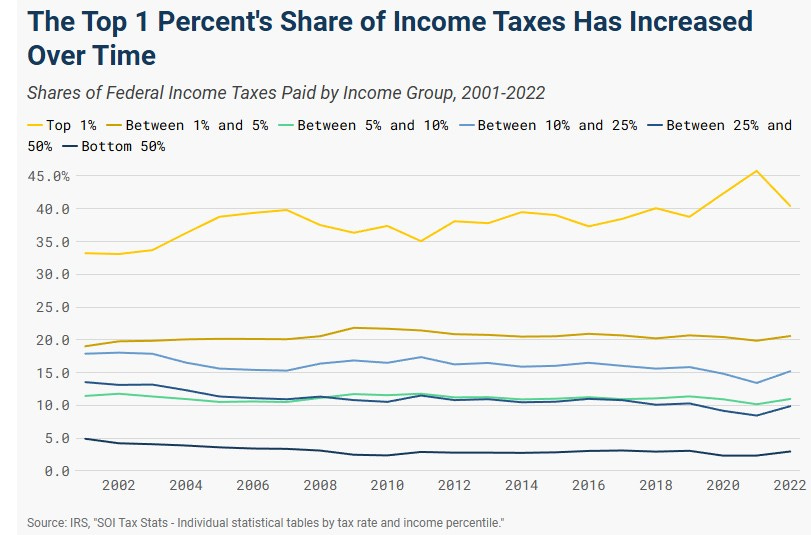
Moreover, that 40% share of the top one percent has already been required to up their share, having grown by nearly a third since 2001, when they paid about 30% of income taxes. During the same period, the bottom 50% share decreased by almost two-thirds, from 4.9% in 2001.
What is fair if you believe that 40% by the top 1% isn’t fair? As a matter of scale, policy makers must not exaggerate the potential revenues available from the top.
In fiscal year 2024, the government spent $6.75 trillion. The number of billionaires was 835, led by industrial and tech magnates, with their total wealth climbing to $5.8 trillion. So let’s do simple long division: even liquidating every dollar of wealth from every American billionaire would merely finance Washington one time for 10 months. And there would be no more billionaires to pay taxes if all their wealth was confiscated. Not even 100% tax rates on earnings over $500,000 could balance the long-term budget.
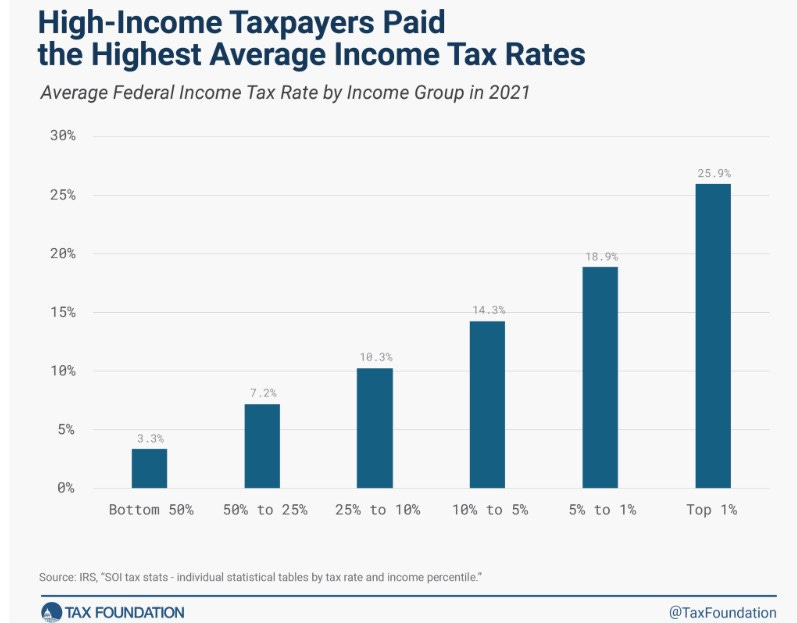
Overall, the top one percent of income pay an average tax rate of about 26% and the lower 50% have an average tax rate of 3.3%.
None of this is to suggest that the tax code couldn’t be tweaked to squeeze some more revenue from the top. But that wouldn’t be enough to make an applicable dent in the long-term deficit at the current rate of spending.
Setting every income, investment, corporate, and estate tax at its revenue-maximizing level for corporations and earners over $400,000 — without any regard to the economic consequences — would probably raise 1 to 1.5 percent of GDP. This is not nearly enough to close budget deficits headed toward 9 percent of GDP within a decade and 14 percent of GDP within three decades under current policies. Also, the common suggestion of applying the Social Security payroll tax to all wages would keep the program out of deficit for less than a decade, according to the Social Security Administration, while using up most of the available room to raise upper-income taxes.
Part 2: The conservatives get it wrong as well
The primary justification that the Republicans have latched on for tax cuts is the Laffer curve, first introduced to the political sphere by economist Arthur Laffer in 1974. which they say shows that tax cuts entirely pay for themselves with the revenues from expanded economic activity. That is, low-income taxes create incentives to work, save, invest, and be productive, which increases overall income and thus generates more tax revenue even at lower tax rates.
Laffer was correct, to a point. However, these benefits only accrue when the marginal tax rates are very high, somewhere in between income tax rates of 55% and 73%. In 2016 the top rate was 39.6% for a married couple on income above $467,000. As a result of the 2017 tax cut by the Republican-controlled Congress, today, the top rate is 37%, only on income above 751,600. So, they are already well below the Laffer Curve rates.
In the current economy, most taxes are not close to their revenue-maximizing rates [That is, the high marginal rates Laffer worked with]. At the current average tax rate of 20 percent, each $1 in tax cuts would need to produce $5 in new economic activity to pay for itself. It is rare that tax cuts (or expenditures) can provide such a substantial economic return.
Revenue often does increase following a tax cut. But, barring a recession, it would have been expected to grow anyway due to growth in the economy, inflation, and higher wages, even in the absence of any changes in tax rates.
Part 3: Where does the government’s money come from?
Most of the revenue the U.S. government collects comes from individual taxpayers and corporate business taxes. Minor sources are excise tax, estate tax, and other taxes and fees. So far in FY 2025, individual income taxes have accounted for 48% of total revenue, while Social Security and Medicare taxes made up another 36%.
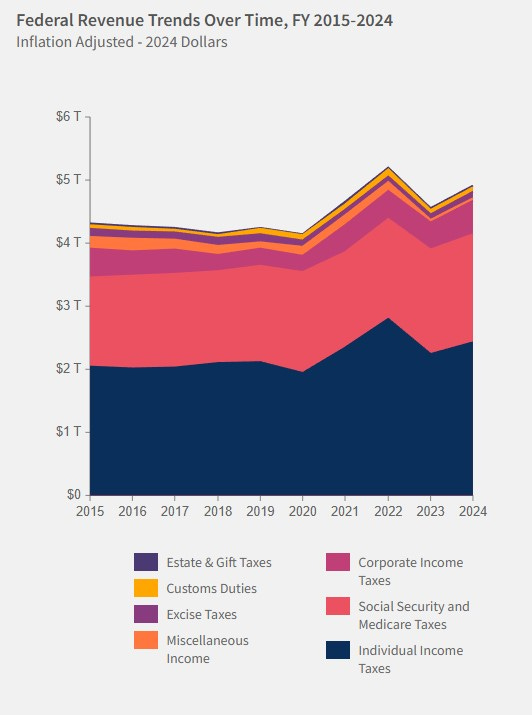
The chart above shows that in most years, just under half of government revenue is from individual income taxes, and roughly a third is from Social Security and Medicare taxes.1 The latter, however, are earmarked for payout for those programs and can’t be allocated to other areas of government operations. Note that while the federal government collected $4.92 trillion, it spent $6.75 trillion. So the difference is the deficit, or the amount borrowed, $1.83 trillion, or about 27% of total expenditures last year.2
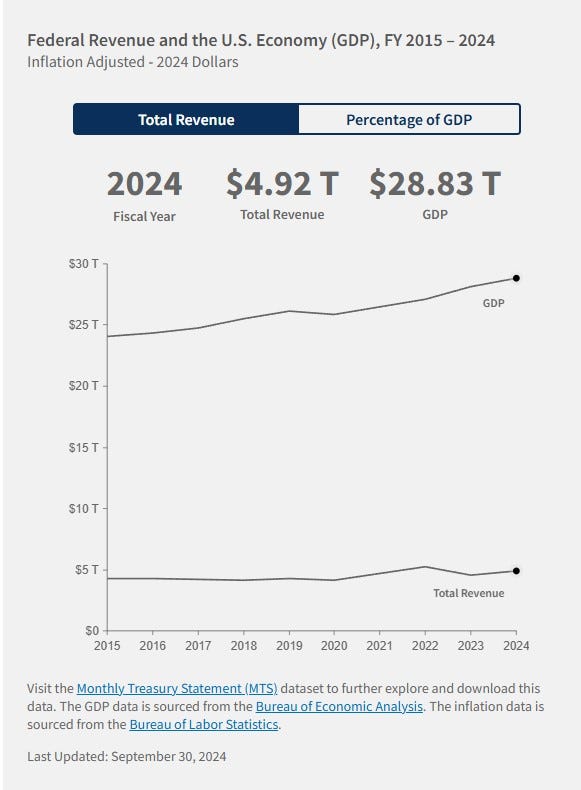
Since 2015, the U.S. economy, as measured by Gross Domestic Product (GDP), has grown an impressive 20%. Tax revenue, however, has only increased by about 14%. You can see the difference in the slope of the two measures in the table below. This suggests that the federal government's footprint related to the size of the country's economic activity has decreased over the past decade. Since federal taxes are based on a percentage of income for people and businesses, the federal revenue from taxes increases as people and businesses earn more.
So what does this mean?
The heck if I know. But I’ll take a stab at it. (And you can see more if you go to the source of the above charts, which allows you to see the actual dollar and percent changes year by year).
Before the 2017 tax cuts, the economy was growing very slowly, and tax revenue was flat after accounting for inflation. However, there was not the promised big bump to the economy in the three years after the tax cuts. The Covid shutdown is an anomaly that affected fiscal year 2021 (July 2020-June 2021). But the economy did really take off after that. This may be attributed to the fulfillment of classical Keynesian theory: the Biden administration pumped billions into Covid relief and infrastructure spending,3 resulting in a 9% growth in the economy and 5.6% greater tax revenue from 2021-2024. This is compared to a 4.4% growth in GDP and a two percent decrease in tax revenue between 2017 and 2020.4
The lessons I draw from this data:
The income tax system is indeed highly progressive, with high-income households contributing substantially more in taxes than their share of income.
Short of confiscatory tax rates at the very top, the amount of additional revenue that could be generated from billionaires or even the top of the multi-millionaires category would barely move the needle of federal revenue.
More than one-fourth of government spending is covered by borrowing. Is that sustainable, with about 13% of the budget just going to interest payments?
The rationale that tax cuts “pay for themselves” through economic growth has not been substantiated over many attempts.
What would you consider a “fair share? Comments are open.
The big jump in fiscal 2021 and 2022 may be an artifact of the unsettled Covid pandemic shutdown and supply chain shortages.
Back in November ,I tried to explain how much a billion really was: It’s 1000 times $1 million. So, if you earn $1 million annually, it would take you 1000 years to have earned $1 billion. And a trillion is 1000 billion. Ergo, it would take you 1000 years to set aside one billion annually to reach a trillion. Or, try this: if you earned $1 million annually, it would take 100,00 years to say you had earned $1 trillion. Yeah, it’s a big number.
This also likely contributed to the spike in inflation in 2022, although supply chain disruptions following the global pandemic likely exacerbated the money supply expansion. Of course, any additional tax cut—putting more spendable cash into the already solid economy— could also spike inflation.
Fiscal year 2020 went from July 2019 to June 2020. So roughly the last quarter of that period, the economy shut down, which would have a small effect on both GDP and tax revenue.
I agree that increasing taxes on the wealthiest will not cover the revenue gap, but that doesn't really address whether paying 40% of total tax revenue is the appropriate amount. After all, in a progressive tax system it's not the % of revenue raised, it's whether the amount taxed is fair. Right now it isn't, for the reasons Geoffrey articulates. I share his view on this, but would add the word loopholes to the discussion. There are inexcusable loopholes throughout the tax code that need to be fixed, such as the unconscionable carried interest exemption. Until those adjustments are made, I have no reason to believe that the 40% figure is either unfair or sufficient given how much money the wealthy are making.
Restore tax rates to the levels prior to George W Bush's massive taxcuts to the billionaires and big corporations, his disastrous wars in Iraq and Afghanistan and Trump's giant tax cut to evn more billionaires and you reduce the deficit by approximately $10 trillion dollar. ie, cut it in half.
Musk wants to cut only $2 trillion dollars out of vital services in order to pay for even MORE tax cuts for the stratospherically rich. I think we're on the wrong track here.
Oh, and while we're at it, maybe you could use your excellent an d thorough expositiory abilities to explain that tariffs are paid by anyone in the US who buys anything from other countries. The higher the tarriff, the more WE pay. Trump seems to think that the country that MAKES the things they sell us pay that tax. Wrong. And excpensive- for US!